

Route 66 is one of the most famous highways in the world. Although it was decommissioned on June 27, 1985, a significant portion of the original route remains drivable today, even as some segments have been replaced by modern interstates.
What sets Route 66 apart is that it was designed to connect Chicago and Santa Monica while also bringing traffic and visibility to hundreds of small towns and rural communities along the route. Gas stations, diners, motels, and roadside attractions grew up around the highway, bringing economic stability to much of the community because of the passing travelers. In contrast, today’s modern interstates are built with speed and direct travel as main priorities.
While many people continue to travel Route 66 for its history and nostalgia, the road’s legacy also includes a long history of serious crashes. During the route’s early decades, it earned the nickname “Bloody 66” because of the dangers of early highway travel. Much of the road remained a narrow two-lane highway, and increasing traffic combined with vehicles that lacked modern safety features made long-distance travel riskier. Over time, infrastructure changes and improvements, along with advancements in vehicle technology, helped improve overall safety and reduce crash risk. Yet, fatal crashes continue to occur along the corridor.
In this study, The Fine Law Firm analyzed four years (2021-2024) of fatal crash data from the National Highway Safety Administration (NHTSA) to identify the rural stretches along the Route 66 corridor that present the highest fatal crash risk. We focused on rural crashes as much of the Route 66 experience takes place outside major cities. The corridor includes a mix of historic alignments, modern highways, and diverging routes. A buffer was created around the Route 66 polyline, and heat map analysis was used to identify areas with the highest concentration of rural fatal crashes.
Because this analysis is based on crash density, the stretches identified vary in size and should not be compared directly as if one is inherently more dangerous than the others. Instead, they should be viewed together as areas where travelers should use extra caution. Understanding where fatal crashes occur can help travelers make more informed decisions before setting out.
Read on to learn more.
Route 66 Fatal Crashes by State
Route 66 covers approximately 2,400 miles from Chicago to Santa Monica, crossing through eight states. By approximate share of route, the states rank as:
- New Mexico (20%)
- Oklahoma (18%)
- Arizona (16%)
- Missouri (13%)
- California (13%)
- Illinois (12%)
- Texas (8%)
- Kansas (1%)
Over the four-year study period, the Route 66 corridor recorded 1,240 fatal crashes. The chart below breaks down all fatal crashes that occurred between 2021 and 2024 in both urban and rural areas by state.
Missouri recorded the most fatal crashes along the Route 66 corridor despite ranking fourth by route share. New Mexico followed closely behind with 272 fatal crashes and California ranks third with 241 fatal crashes over the study period.
Deadliest Stretches Along Route 66
Since much of the Route 66 corridor passes through rural areas, and many of the attractions along the route are located outside urban centers, we focused our analysis on rural fatal crashes. This provides a clearer view of the risks Route 66 travelers may face, while limiting the influence of urban crashes tied to local traffic and commuting.
Several states, including Illinois, Missouri, Oklahoma, New Mexico, and Arizona, preserved portions of Route 66 under the historic Route 66 name. To account for the different ways Route 66 appears on the modern landscape, we categorized each stretch based on its relationship to the historic alignment. The definitions are as follows:
Concurrent Alignment
Historic Route 66 and the modern highway occupy the same roadway.
Offset Alignment
Historic Route 66 exists as a separate roadway within the same corridor. It may run parallel to a modern highway.
Hybrid Alignment
The segment contains a mix of concurrent or offset conditions. It may transition between overlapping and separate alignments.
The table below includes the eight rural road stretches along the Route 66 corridor with the highest concentration of fatal crashes. For each stretch, it lists the alignment type, approximate length in miles, total fatal crashes and fatalities during the four-year study period, route labels, and approximate start and end references based on the nearest perpendicular road to each endpoint.
Deadliest Rural Stretches of Route 66 Corridor
Based on four years of national fatal crash data (2021–2024)
| State | Alignment Type | Length (mi) | Fatal Crashes | Fatalities | Route Labels | Start Reference | End Reference |
| New Mexico | Full Concurrency | 21 | 18 | 25 | I-40, Historic US-66 | Indian Service Rd 542 | Shelly Dr SW |
| Missouri | Offset | 25 | 18 | 22 | I-44, MO 266 | W Mount Vernon Blvd | S Farm Rd 81 |
| California | Hybrid (Concurrency + Offset) | 17 | 16 | 18 | I-15, Historic US-66, Cajon Blvd, Historic US-99, Historic US-395 | Glen Helen Pkwy | Ranchero Rd |
| New Mexico | Hybrid (Concurrency + Offset) | 14 | 15 | 20 | I-40, Historic US-66, NM-122 | NM-612, NM-371 | NM-606 |
| Arizona | Full Concurrency | 17 | 12 | 14 | I-40, US-180, Historic US-66, AZ-99 | Meteor Crater Rd | Hipkoe Dr |
| New Mexico | Full Concurrency | 17 | 12 | 12 | I-40, Historic US-66 | US Hwy 285 | NM-3 |
| Missouri | Offset | 12 | 10 | 12 | I-44, Old 66 | Hillcrest Rd | Grotemac Lake Rd |
| New Mexico | Offset | 11 | 9 | 13 | I-40, NM-134, Historic US-66 | Indian Service Rd 40 | NM-279 |
Please note: Road stretch lengths are approximate and represent the primary roadway alignment. Some stretches include diverging paths, making their total length longer than reported. Start and end references are approximate and are based on the nearest perpendicular road to each stretch. Route labels refer to the main highway or Route 66 alignment and do not include separate diverging roads or alternate alignments where present. Refer to the map for the exact road layout.
Interactive Map
Zoom in on the map below to see specific deadly stretches, or zoom out for a broader view. Hover over a section of road for more information.
New Mexico
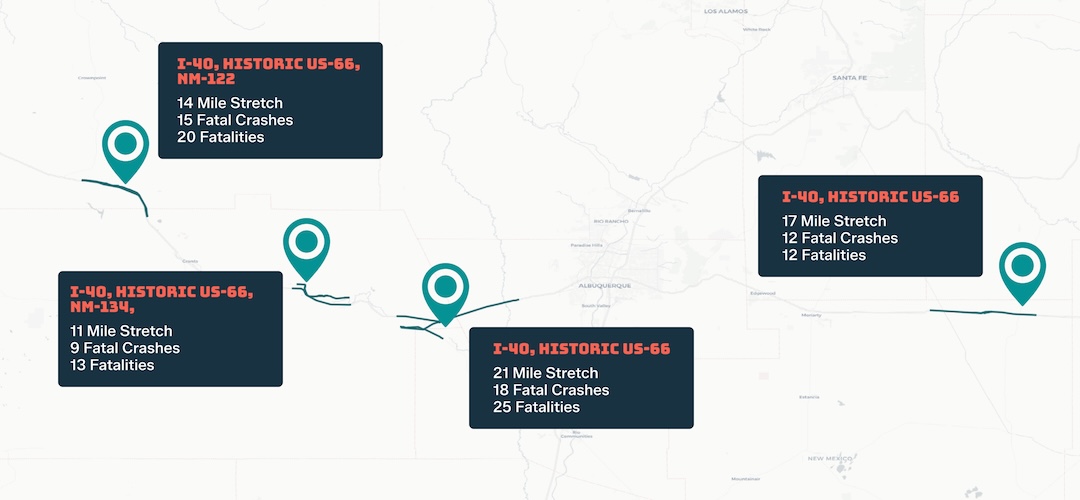
To the east on the map below, a concurrent 17-mile stretch on I-40 recorded 12 fatal crashes and 12 fatalities. It is located east of Albuquerque near the Moriarty Longhorn Ranch and vintage motels, famous for providing a nostalgic Route 66 experience.
Moving westward, three additional stretches with high fatal crash concentrations were identified, making New Mexico the state with the most deadly Route 66 corridor stretches. West of Albuquerque, a 21-mile stretch near the historic Rio Puerco Bridge area, recorded 18 fatal crashes and 25 fatalities. This stretch passes by “Dead Man’s Curve,” a notorious historical alignment.
Back in the late 1920s and early 1930s, one had to drive a sharp curve around a massive sandstone cliff just past Owl Rock near Mesita. This road segment was known as Dead Man’s Curve as it was extremely dangerous. Drivers could not see oncoming traffic because the cliff completely obscured their view, causing many severe crashes. At high speeds, there was also a severe risk of losing traction on the early road, wiping out, or sliding off the edge. While the loop still exists today and is visited as a historical site at low speeds, travelers can skip it entirely by continuing on I-40. Historically, another Route 66 alignment in Towanda, Illinois, earned the same nickname in the 1920s because it featured a sudden, tight 90-degree turn that has now been bypassed.
The West-Central stretch is an 11-mile stretch with an offset alignment of historic Route 66 that recorded 9 fatal crashes and 13 fatalities.
The Westernmost stretch in New Mexico is a 14-mile road stretch with a mix of concurrent and offset Route 66 alignments that recorded 15 fatal crashes and 20 fatalities over the study period. The stretch sits near Roy T. Herman’s Garage & Service Station in Thoreau, near the Continental Divide, which was listed on the National Register of Historic Places in 1993.
Missouri
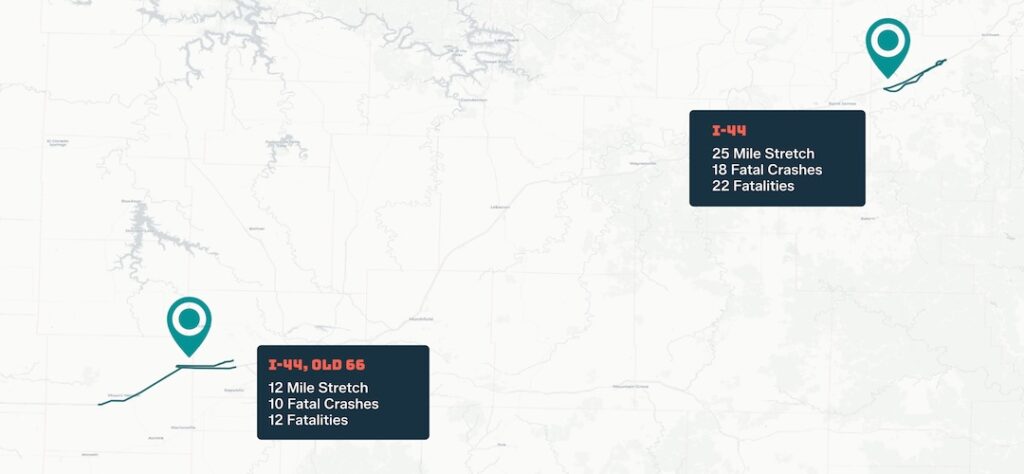
Two deadly stretches were identified in Missouri. One stretch spanning 25 miles and recording 18 fatal crashes and 22 fatalities sits just west of Springfield, Missouri. The city is actually referred to as “The Birthplace of Route 66”, as it was the official city where the numerical designation of “66” was established in 1926. The older MO 266 segment corresponds to the original Route 66 alignment and passes through Spencer, Missouri, a restored ghost town visited for its vintage sites.
The second stretch sits further northeast and connects several notable locations, including Cuba, known as the “Mural City”, and the Wagon Wheel Motel, which is the oldest continuously operating motel along Route 66. It also passes through Rolla, the college town home to the Missouri University of Science and Technology. This stretch spans approximately 12 miles and recorded 10 fatal crashes and 12 fatalities over the study period.
While neither of the identified modern stretches are near it, historically a segment in Devil’s Elbow, Missouri, nicknamed after the city and river bend, followed a twisty path down the steep mountain cliffs and across the river that required extreme caution from early motorists. Drivers had to deal with blind turns, steep drops, and icy winter roads in a narrow yet essential passage for civilians and the Military Base which was nearby. Engineering projects have eliminated the danger since.
California
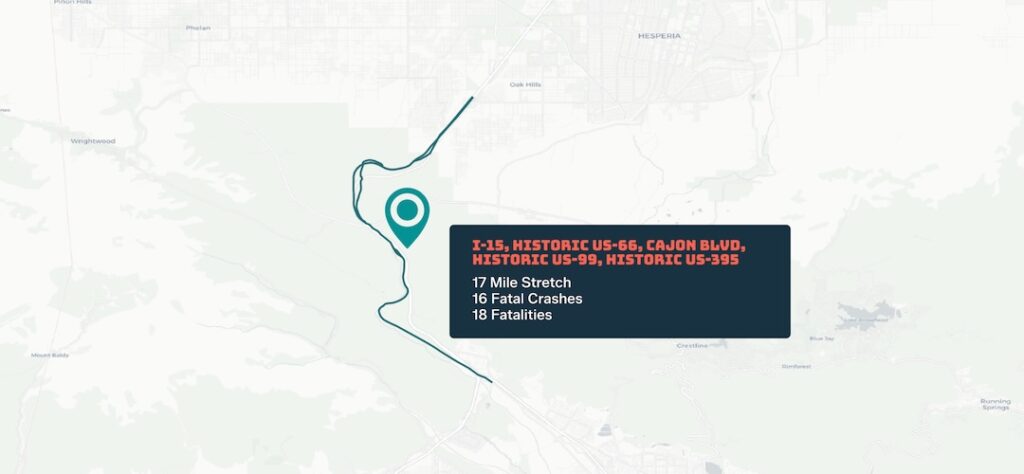
In California, a 17-mile stretch with portions of concurrent and offset Route 66 alignments recorded 16 fatal crashes and 18 fatalities. The stretch covers the Cajon Pass corridor, which contains original Route 66 alignments and sits between two mountain ranges: the San Bernardino Mountains and the San Gabriel Mountains. The pass connects the high Mojave Desert to San Bernardino and features a challenging geography where the road drops incredibly fast with a steep downhill incline when driving southbound.
The road portion actually shares some historical challenges in that early cars would often overheat trying to climb up the stretch, with some losing their brakes and sliding back down as a result. Moreover, this pass has always been troubled by high winds. The force of the desert gales through the narrow gap increases dramatically, which has historically caused multiple incidents where high-profile vehicles like semi-trucks roll over. As a result, officials actively monitor wind speeds to provide warnings or bans beforehand. Even today, the road presents a stressful drive for many people.
Arizona
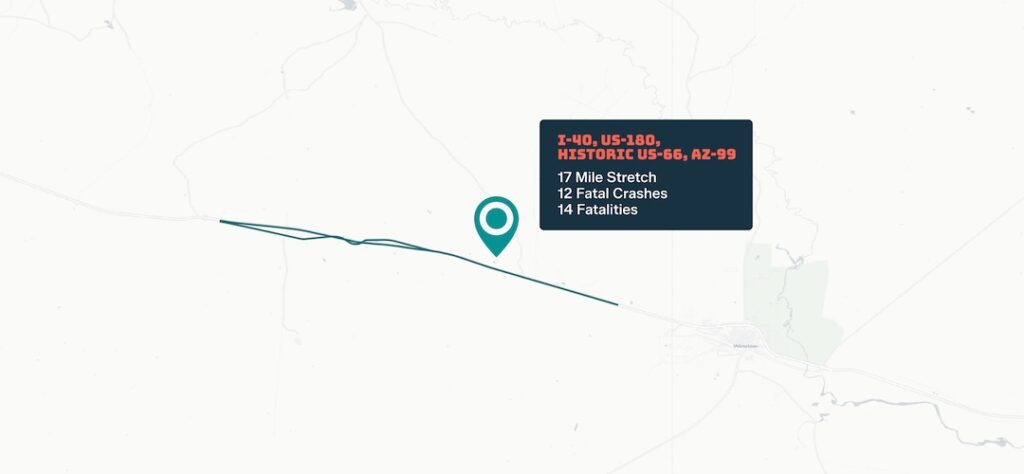
A stretch in Arizona was identified covering 17 miles of plain terrain where traffic moves at very high speeds. Because the road is so straight and flat, routes of this type tend to lull drivers into a passive state where sudden situations are more likely to catch them off guard. This stretch recorded 12 fatal crashes and 14 fatalities over the study period. It sits just west of Winslow, Arizona, a historic Route 66 town famous for the “Standin’ on the Corner” Park and the landmark La Posada Hotel.
What Time of Day Do These Fatal Crashes Occur?
More than 40% of fatal crashes along the Route 66 corridor occurred between 5 p.m. and midnight over the four-year period. In other words, seven hours accounted for about two in five fatal crashes.
By individual hour, 8 p.m. saw the highest proportion of crashes at 6.95%. This pattern reflects broader crash patterns where traffic remains relatively high, yet visibility decreases after sunset, and impaired driving becomes more common.
Methodology
We created a buffer around the Route 66 corridor polyline to capture fatal crashes from the National Highway Traffic Safety Administration’s Fatality Analysis Reporting System database that occurred within the corridor between 2020 and 2024. Because Route 66 no longer exists as a single continuous highway in its original form, crashes were analyzed across the full Route 66 corridor, which includes varying combinations of historic Route 66 segments, modern highways, concurrent highway segments, frontage roads, and alternate alignments.
To identify the sections with the highest concentration of fatal crashes, we used heat map analysis to locate areas with the greatest crash density. We then estimated the length of each section by measuring the distance between its endpoints. Because some sections include diverging or parallel routes, the actual roadway mileage may be greater than the reported length.
State mileage estimates were compiled from McClanahan’s EZ66 Guide for Travelers and corroborated with state Route 66 historical and tourism sources. Values represent commonly cited alignments rather than a single official measurement.
Fair Use Statement
If you’d like to share this information with other travelers, you are welcome to do so. We just kindly request that any republication or distribution of our findings include a link back to this page so readers can reference the full scope and methodology.